C120 LNB Tests On Precision 1.8m Dish

moonbase

Small Dish Man
My Satellite Setup
.
My Location
UK
Hi,

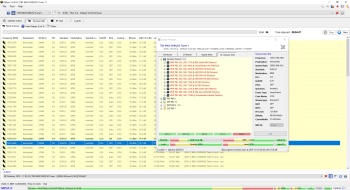
There are some pictures attached below that show the test results from four different C120 LNB's on a Precision 1.8m dish. The db figures in the tables are EBSPro S/NR values similar to what would be displayed by a satellite receiver. The LNB's were all tested yesterday afternoon in the same weather conditions with the dish on the cluster of 4 satellites located around 00.8 West.

I might add a set of WR75 LNB test columns to the tables at a later date and also one or two more C120 columns. I have a couple of other C120 LNB's that I did not get round to testing and a batch of different WR75 LNB's.
 

Attachments

  • C120 LNB's.webp
    C120 LNB's.webp
    198.5 KB · Views: 56
  • LNB Comparison - 00.8W Group (01).webp
    LNB Comparison - 00.8W Group (01).webp
    207.6 KB · Views: 56
  • LNB Comparison - 00.8W Group (02).webp
    LNB Comparison - 00.8W Group (02).webp
    34.9 KB · Views: 52
Last edited:
Nice move @moonbase :D How did you collect signal levels? Not manual , I think!
And after tests, what is your conclusion?
 
Nice move @moonbase :D How did you collect signal levels? Not manual , I think!
And after tests, what is your conclusion?


I used EBSPro to do the scans, it keeps historic scan results in its database so it was easy to go back to them. My conclusion is that there is not much difference between the 4 LNB's that I tested on the cluster of 4 satellites grouped around 00.8W. However, the signal levels were all quite high so the test was not able to see how each LNB responded to low level signals. The test would need to be repeated on a satellite where some of the signal levels were lower and closer to the level needed for a lock
 
Maybe tests on some fringe satellite can give more visible difference in performance?
 
Maybe tests on some fringe satellite can give more visible difference in performance?


Yes, that would be an option. The ideal type of satellite would be one that has fringe Ku band transmissions in all 4 frequency/polarity bands.
 
Or you could mask off some of the reflector with a wet towel.
 
Is this using BLScan or BLScan2, as EBSPro scans don't always report the correct SNR using BLScan2?
Maybe the same with BLScan, but haven't used it lately. See my 'scan' versus the 'live' snr figures.


Click the image for full size.
 
Is this using BLScan or BLScan2, as EBSPro scans don't always report the correct SNR using BLScan2?
Maybe the same with BLScan, but haven't used it lately. See my 'scan' versus the 'live' snr figures.


Click the image for full size.


@Dave5118

Thank you for your feedback re the incoherence you found with the SNR figures. If I read it correctly, that is quite a gap between 14.1db in the scan result table and 19.3db from the Signal Analyser. It is an interesting observation and definitely something to check.

I used a TBS5925 USB unit connected to a laptop with EBSPro in BLScan mode. At a quick glance, the SNR seemed to be approximately aligned to the figures from a Dr HD F15 satellite receiver but I did not do a detailed check due to the number of transponders and testing 4 LNB's.

I might repeat the test on 7.0W, there are a few transponders from Eutelsat 7 West A on the N. W. Africa beam that were with a low signal level yesterday afternoon.
 

Attachments

  • LNB Comparison - 07.0W Group.webp
    LNB Comparison - 07.0W Group.webp
    29.7 KB · Views: 27
Is this using BLScan or BLScan2, as EBSPro scans don't always report the correct SNR using BLScan2?
Maybe the same with BLScan, but haven't used it lately. See my 'scan' versus the 'live' snr figures.


@Dave5118

I tested the EBSPro scan table list vs the Signal Analyser for both BLScan and BL2Scan modes and the result was the same. The scan table list reports SNR at lower levels than the signal analyser. The test was done using a TBS6980 card so it is not just confined to a TBS card model, it looks to be a bug in the EBSPro software.

I am not sure if this issue has been mentioned before on the forum or if the developer of EBSPro is aware of the issue? I wonder if the issue came in with a particular version of EBSPro? Version 16 and later sub versions are free, Prior to version 16 a license was required for full operational functionality and obtainable for a small fee.

I just did a test with Crazy scan on the test frequncy of 12014 H from 0.8W and it reported the SNR as 14.7db, same as the scan table list of EBSPro. The Signal Analyser in EBSPro and a Dr HD F15 receiver both report the SNR at 19.2 db.
 
Last edited:
Back
Top