
You are using an out of date browser. It may not display this or other websites correctly.
You should upgrade or use an alternative browser.
You should upgrade or use an alternative browser.
Badr7 26e
- Thread starter solly
- Start date


- My Satellite Setup
- Some SAT-related hardware.
- My Location
- N-E from Riga
That ir day-time dependent, cuz during the day signal is changing considerably. For exampleUsed to be 2db stronger


ocean04
Regular Member
- My Satellite Setup
- 3m 28.5E (53E-8W), 2.4m Aerial AS24 (68.5E-47.5W), Edision OS MIO 4K, Octagon SF8008, Vu+ Zero 4K..
- My Location
- Western Finland (63N 22E)
It's not normal signal variation. 10970V was possible here with 1.8m 2016/17, but not anymore. It's actually -3db average (was using 2.4m back then)That ir day-time dependent, cuz during the day signal is changing considerably.
Try it your self, see if you can get 8db values today. Same time you can check Eshail2.
10730H 30000 5.5db (Nobody has reported to Lyngsat)
10850H 27000 7.5db
11350H 30000 4.0db (Wrong satellite in Lyngsat)
Last edited:

stel883_
Member
- My Satellite Setup
- "Gibertini OP125L - Multifeed 7E [10E] 13E 16E - Golden Media 201, Goobay 67269, Triax TSI 100 Gold, Fracarro Ux-S LTE, Engel Diseqc 4x1 SW0211" "Gibertini OP100L - Moteck SG-2100A DiSEqC Motor 34.5W-80.0E - GT-SLRC2" "Dreambox DM900 RC20 4K UHD, Edision OS Mini 4K, Zgemma H11S 4K "Toshiba 32L3963DG" "Fujitsu Lifebook S752 - MX-23.2 "Libretto"
- My Location
- Vátika, Greece
Gibertini OP100L, Southern Peloponnese


stel883_
Member
- My Satellite Setup
- "Gibertini OP125L - Multifeed 7E [10E] 13E 16E - Golden Media 201, Goobay 67269, Triax TSI 100 Gold, Fracarro Ux-S LTE, Engel Diseqc 4x1 SW0211" "Gibertini OP100L - Moteck SG-2100A DiSEqC Motor 34.5W-80.0E - GT-SLRC2" "Dreambox DM900 RC20 4K UHD, Edision OS Mini 4K, Zgemma H11S 4K "Toshiba 32L3963DG" "Fujitsu Lifebook S752 - MX-23.2 "Libretto"
- My Location
- Vátika, Greece
Gibertini OP100L, Southern Peloponnese


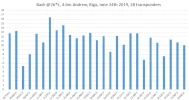
Pointed antenna towards Badr @26*E. Scanned all possible transponders and put all data in the spreadsheet, then created the graph. View attachment 125133
Nice, that is an interesting way of presenting a scan result, it looks good, an excel chart version of a scan. Did you exclude any signals from E'sh-1 at 25.5E ?
- My Satellite Setup
- Some SAT-related hardware.
- My Location
- N-E from Riga
I like this way better than presenting lots of screenshots. You are right, Enigma2 does the scan and creates txt file, than I transfer data to excel and make graph. That how txt data looks 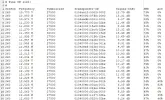
P.S. Yes, E'sh-1 @25,5*E transponders are not included.
P.S. Yes, E'sh-1 @25,5*E transponders are not included.
Last edited:

Lexzie
Member
- My Satellite Setup
- Xtrend ET10000 DVB-C, DVB-S2, and IPTV
Dreambox DM920 DVB-C/DVB-S2X/DVB-T2
TBS 5925 USB-tuner
80 cm fixed dish (28.2E/23.5E/19.2E/13E)
180cm Channel Master offset dish with polarmount (39E-34.5W, Ku-band)
- My Location
- The Netherlands
How to create such a textfile or where to find it?
- My Satellite Setup
- Some SAT-related hardware.
- My Location
- N-E from Riga
@Lexzie read here Using Linux Receivers To Create Signal Graphs - SatsUK
Perhaps download link for script is not working, I will fix it later today.
Perhaps download link for script is not working, I will fix it later today.
How to create such a textfile or where to find it?
There are options with EBSPro to create excel files and charts for satellite scan results.
To save the result of a single scan with EBSPro:
1. Tick the "save tps in a file ......." box in the blind scan options screen.
2. Select xml file format.
3. Nominate a folder where the single scan file result is to be saved.
The output xml file can be opened in excel and a chart created.

EBSPro also allows the entire scan results database to be analysed. This contains the results of all historic scans unless it has been emptied at which point it starts again and saves all scan results moving forward. There is a topic on how to work with the EBS Pro scan results database available from the link below.
Just Sharing This - Exporting EBS Pro Scan Database For Creation Of Result Lists
Hi, I am not to sure if this topic will be of interest to many but for those with a slight inclination to tinkering with EBS Pro and using the results for scan comparisons it might be useful? The EBS Pro database containing the history of all scans can be exported from the database and setup in...
 www.satellites.co.uk
Returning to 26 East, I have attached below a chart and a table that present my miserable effort at scanning this cluster of satellites. From a UK location you need a big dish and a favourable geographic location with respect to the beam footprints.
I achieved a lock on some of the transponders but was some way adrift of securing a lock on the others. The Badr-4 frequencies were easily lockable but a toddler with a dustbin lid can pick those signals up, they offer no challenge to the UK located extreme fringe men. For the satellites at this 26 East cluster other than Badr-4 I had very limited success, more dish acreage is needed.
I included two data points in the chart, the column in the foreground is the signal level required for a lock, the column in the background is the signal level I achieved. Hopefully the use of two data points per frequency provides comparative visibility of the lock level and the signal achieved level?


I achieved a lock on some of the transponders but was some way adrift of securing a lock on the others. The Badr-4 frequencies were easily lockable but a toddler with a dustbin lid can pick those signals up, they offer no challenge to the UK located extreme fringe men. For the satellites at this 26 East cluster other than Badr-4 I had very limited success, more dish acreage is needed.
I included two data points in the chart, the column in the foreground is the signal level required for a lock, the column in the background is the signal level I achieved. Hopefully the use of two data points per frequency provides comparative visibility of the lock level and the signal achieved level?
The chart in the above post was a bit congested and included contributions from the dustbin lid satellite (Badr-4). I have removed the Badr-4 scan results from the chart source data set and refreshed the chart. Also, the frequency axis of the chart now includes the satellite and beam information.
In addition, I moved my SNR signal achieved levels to the foreground and placed the corresponding lock levels in the background. It may possibly present a clearer view of how far I was away from a lock on some of the frequencies. You gotta go large on this Bad Boy cluster of satellites from a UK location, I am scratching around getting very little success and managed a lock on only 9 of the 29 frequencies in the chart attached below.
We need a UK Big Dish Man to come along and sort this Bad Boy out.

In addition, I moved my SNR signal achieved levels to the foreground and placed the corresponding lock levels in the background. It may possibly present a clearer view of how far I was away from a lock on some of the frequencies. You gotta go large on this Bad Boy cluster of satellites from a UK location, I am scratching around getting very little success and managed a lock on only 9 of the 29 frequencies in the chart attached below.
We need a UK Big Dish Man to come along and sort this Bad Boy out.
- My Satellite Setup
- Some SAT-related hardware.
- My Location
- N-E from Riga
Yes, it is #1 in my graph.You should also receive 10770V 27500
10730H 30000 and 11350H 30000 are Eshail2 as noted before. You should also receive 10770V 27500
Thank you for pointing out the incorrectly allocated satellite.
Last edited:

RustySpoons
Sleepy Hollow
- My Satellite Setup
- 50E - 30W
2x CM 1.2m Polar Mount/Jack
65E- 65W
Gibertini 1m OP100 - STAB HH100 - Inverto Black Ultra 0.2 Twin
Mutant HD51
Edision Primo IP S2
Dreambox DM800HD
Venton Unibox HD2
Sony Bravia 55" 4K
- My Location
- South Wales
Getting a signal from 10770 V 27500 but no picture/audio.

Getting a signal from 10770 V 27500 but no picture/audio.
View attachment 125164
10770 V, SR27500 is from Es'hail-2 at 25.8 East on the MENA beam which needs 7.9db to get a lock. I am getting 3.6db to 3.8db fluctuating with a 1.5m dish, way below lock level.
Last edited: